


04/06/24
Chipping away a little bit more

Hello all, hope you are well.
Picking up from yesterday, I played a bit more with Julia and the Plots package. Thanks to a very helpful, short tutorial by TutorialKart, I was able to generate some very simple graphs.
This was in the ball-park of what I was trying to achieve originally with Python and Matplotlib (I like Matplotlip because the GUI has an option to save the graph to a location of your choice; unfortunately saving the image in Julia is not as simple).
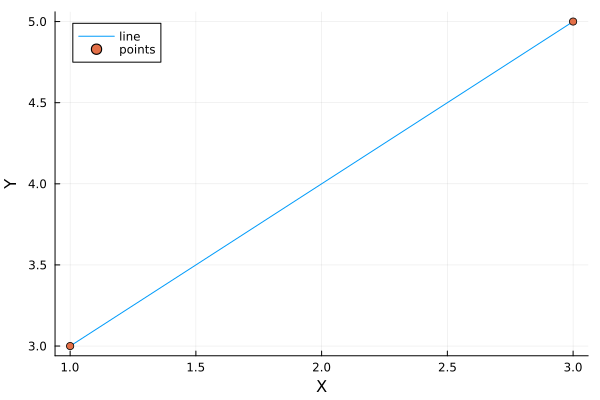
This graph is very bare-bones, so it represents the coordinates of (1, 3),(2, 5) - the first example in the “Lines and Slopes” part. One day, these graphs should get better and more informative/appealing.
Going through and finishing this part was just going back over stuff I remember from years ago, but at least that tells me I retained something from my adolescence!
Didn’t get through too much today as it was more learning Julia code and graphing the examples and learning to solve problems digitally (no more messy books, only messy notes!).
Over time, my work flow should improve. In the mean time, slow and steady - with an emphasis on the SLOW!
Also changed the layout of my notes to reflect the addition of images of graphs. I am thinking more about how to improve the interactiveness of my notes too. Still trying to achieve some “fluidity” with these notes.
Simple and easy day. Hope yours was too!
Steve Frampton.